Road Network Operations
& Intelligent Transport Systems
A guide for practitioners!

Road Network Operations
& Intelligent Transport Systems
A guide for practitioners!
Congestion charging, also known as ‘Congestion Pricing’ relies on charging to manage traffic demand in a congested area – for example, a Central Business District (CBD) and other well-defined area. The objective is to keep traffic demand under control with a balance between alternative transport modes. A major benefit for drivers is more consistent journey times (See Case Study – Congestion Charging).
Electronic charging for these purposes should be implemented in a way which minimises any wider negative impacts on other modes transporting people and goods through the congestion charge zone – since this could reduce economic activity within the zone.
Reducing traffic demand can free-up road capacity for reallocation to support other transport priorities – such as public transport (such as bus lanes), pedestrians (allowing longer green times at crossings) and cycling (dedicated or mixed-use facilities). This needs careful consideration and assessment of impacts since it can lead to unintended negative effects. For instance, any reallocation of the road space, reduces the residual space available to vehicles that have paid a congestion charge and could result in an increase in their journey time. This would be contrary to the initial objectives of the congestion charging policy.
Where the core policy is demand management – charges may be differentiated by congestion, vehicle type, time-of-day and other factors. Additional policies may include the reduction of emissions – in which case congestion charges will need to be differentiated by vehicle emissions as well.
The options for implementing congestion charging include:
Since congestion charging is usually introduced onto an existing road network, it needs to be accompanied by:
A congestion charge may be unpopular with road users although the level of support may increase once the benefits have been sufficiently demonstrated (such as in Stockholm). A successful policy needs to be:
The operational strategy must support these goals. The objectives must be realistic and achievable – and measures of performance reported publicly at frequent intervals to retain public support. Alternative approaches to achieving them could include:
The number of road users willing to pay a fee to access a route or area will vary with changing fee levels. This is known as the ‘Price Elasticity of Demand’ (PED). A low PED means that a variable pricing policy is less efficient:
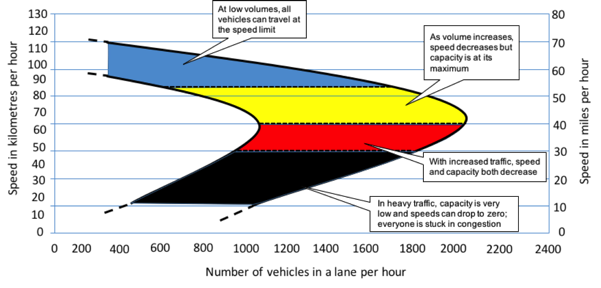
The relationship between the speed of vehicles and the number of vehicles that pass a given point in an hour is known as a ‘backward bending curve’. It is illustrated in the speed-flow diagram below – and demonstrates that a reduction in demand (caused by imposing a fee) has the effect of increasing road capacity and speed. Since it is usually the peak load traffic that causes congestion, it doesn't necessarily require a huge traffic reduction to increase the traffic flow substantially. In light traffic, all vehicles can travel at similar speeds in free flow conditions but as the volume of traffic increases the speed decreases. As the traffic increases further, the speed and capacity both decrease until road users are stuck in congestion.

The relationship between price and demand is at the heart of the policy of congestion charging, as shown in Singapore, London (UK), Gothenburg and Stockholm (Sweden).

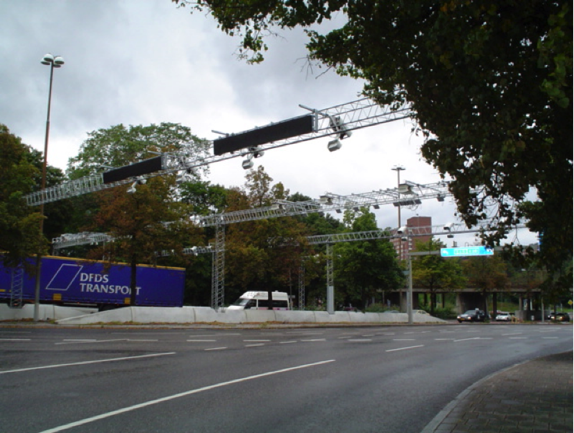
A vehicle may be identified by its number plate (read by one or more cameras) on entry to, and exit from, and within, a regulated area or defined route. Most commonly, reading a vehicle’s number plate will be sufficient to record a vehicle’s presence and to help match it with a payment (such as the systems in Stockholm and London). Alternatively:
Typically, compliance is based on a vehicle being fitted with a valid tag, OBU or a number plate that is associated with a pre-paid account.
Images of non-compliant vehicles may be used as evidence for enforcement purposes – although users may be given a short period of grace during which they can pay the charges before any penalties or legal processes are started. As with tolling (See Toll Collection), a back office and enforcement processes are necessary to ensure compliance, to deter non-compliance and to recover revenues (See Back Office/Enforcement).
Congestion charging must be implemented within a clear policy framework – bearing in mind that:
The technology options for charging and the operations strategy are defined by the congestion charging policy.
If the policy changes in the future – the technology and operations strategy may also need to change. For example, if a policy goal is to support increased use of low emission vehicles and discounts are provided on their use in the congestion charging zone - there must be some means of ensuring that only low emission vehicles receive the discount. This may require establishing a database of vehicles registered for the scheme and their emission classes.
Any congestion charging system must be planned so that it can be ‘scaled’ up in the future. The most common changes are likely to include variations in discounts offered, increasing the geographic area of the charging zone, enabling interoperability with other charging schemes (or tolled routes) – and the use of more tags or OBUs(See Standardisation & Interoperability Issues).
The alternative strategies to pricing as a demand management tool include:

US Federal Highways Administration, HERS-ST Highway Economic Requirements System - State Version: Technical Report, Appendix C Demand Elasticities for Highway Travel: http://www.fhwa.dot.gov/asset/hersst/pubs/tech/tech11.cfm
Land Transport Authority (Singapore): http://www.lta.gov.sg/content/ltaweb/en/roads-and-motoring/managing-traffic-and-congestion.html
Transport for London (UK): http://www.tfl.gov.uk/cc
Swedish Transport Agency (Sweden): http://www.transportstyrelsen.se/en/road/Congestion-tax/
Transport for London (2003) Impacts Monitoring – First Annual Report, Transport for London (http://www.tfl.gov.uk/assets/downloads/Impacts-monitoring-report1.pdf)
Pickford A. and Blythe P. (2006) Road User Charging and Electronic Toll Collection, Ch2, Artech House.
Smeed R. (1964) Road pricing: The Economic and Technical Possibilities. UK Ministry of Transport, HMSO, London.
Vickrey, W.S. (1969) Congestion Theory and Transport Investment. American Economic Review 59 (Papers and Proceedings) pp 251-260.
Hau, T. D. (1990) Electronic Road Pricing: Developments in Hong Kong 1983-1989. Journal of Transport Economics and Policy 24 No. 2, May, pp203-214.
US Department of Transportation: http://www.etc.dot.gov/index.htm