
Road Network Operations
& Intelligent Transport Systems
A guide for practitioners!

Road Network Operations
& Intelligent Transport Systems
A guide for practitioners!
One of the two main starting points for creating a new ITS architecture from an existing ITS architecture is the European ITS Framework Architecture, commonly known as the FRAME Architecture. This example is based on the work done to create an ITS architecture for a local road authority in the UK (the County of Kent) who has given permission for its use in this web resource.
To use the FRAME Architecture to create an ITS architecture that will support the services agreed with the stakeholders will involve taking the following steps.
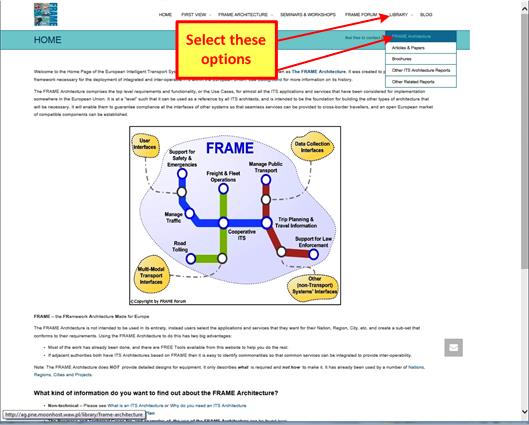
Step 1. Visit the FRAME Architecture website (http://www.frame-online.net/) and select the "Library" tab and click on "FRAME Architecture" as shown below. (Click + to show)
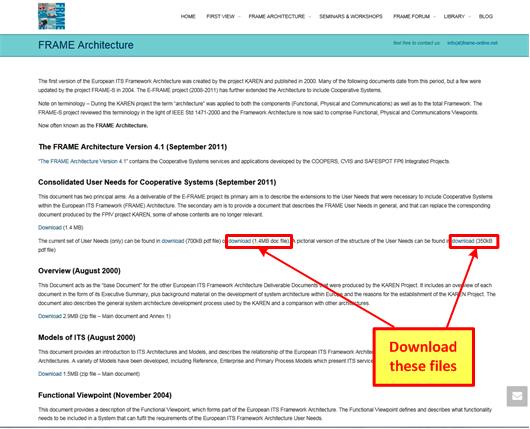
Step 2. On the next web page that is displayed, download the User Needs (1.4M doc file) plus the pictorial version of the structure of the User Needs (350kB pdf file), as shown below, and save both files. (Click + to show)
Step3. Create a spread sheet, then copy and number the Service Descriptions generated by the architecture team (and approved by the stakeholders (See How to Create One?),into the two left hand columns. Label the columns to the right with headings for the FRAME User Needs Numbers and User Needs Descriptions that elaborate each Service Aspiration, plus (optionally) an extra column for Assumptions, Cross References to Other Matches, or Comments.
Step 4. Go through the Service Descriptions and find the relevant FRAME User Need Descriptions in the "1.4M doc file" downloaded in Step 2. Studying the table of FRAME User Needs will help to identify the right Groups of User Needs to consider. For the moment at least, ignore the Group 1 User Need Descriptions as these are "general" and can be used later, in the procurement process. These relate to issues such as adaptability, continuity, data quality, privacy, robustness, safety, security and user friendliness - all of which will need to be addressed in one way of another by various parts of the ITS implementation.
Copy into the spread sheet the Number and Text of the FRAME User Need Descriptions into the appropriate row(s) opposite the Service Aspiration to which they are relevant, duplicating rows if more than one User Need Description is needed to completely match a Service Aspiration. The table that is produced should look like this:
|
Stakeholder Services |
Matching User Need (FRAME) |
Comment | ||
|
Service Number |
Service Description |
FRAME Number |
User Need Description |
|
|
2.1 |
The expected town expansion with 10-15k new homes and extra shopping facilities must be supported with suitable traffic management and public transport services. |
10.1.0.1 |
The system shall provide effective and attractive PT. |
|
|
2.1 |
The expected town expansion with 10-15k new homes and extra shopping facilities must be supported with suitable traffic management and public transport services. |
10.1.0.3 |
The system shall be able to assist PT operators in planning for the optimum use of existing resources to meet the demand. |
This User Need also called up by service 2.2. |
|
2.2 |
There is an overall need to optimise the use of the existing road infrastructure, improve Public Transport services, and improve the facilities for cyclists and pedestrians. |
10.1.0.3 |
The system shall be able to assist PT operators in planning for the optimum use of existing resources to meet the demand. |
This User Need also called up by service 2.1. |
Step 5. From experience it is a good idea for the Architecture Team to carry out this work individually and then compare their results when all the Service Aspirations have been processed. The end result will be consensus on a table showing the agreed list of User Need Descriptions that match the stakeholders’ Service Aspirations.
Step 6. Do not be afraid of deciding that not all parts of one or more the Service Descriptions can be matched to one or more User Need Descriptions. If this happens, the FRAME Architecture can be extended so that it provides the support for these services. How to do this is described in Part 3 of the FRAME Selection Tool Reference Manual, which is available from the same web page as the tool itself – see Step 10 and also Step 7 which follows.
Step 7. If as a result of your work in Steps 5 and 6 you decide that you do need to extend the FRAME Architecture, it is essential to see what is in it. To do this on the FRAME website click on the "FRAME Architecture" tab and select "The Browsing Tool" option, which will show the web page from which the Tool can be downloaded. (Click + to show)
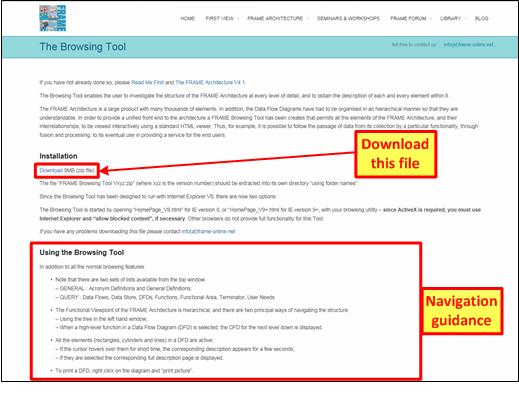
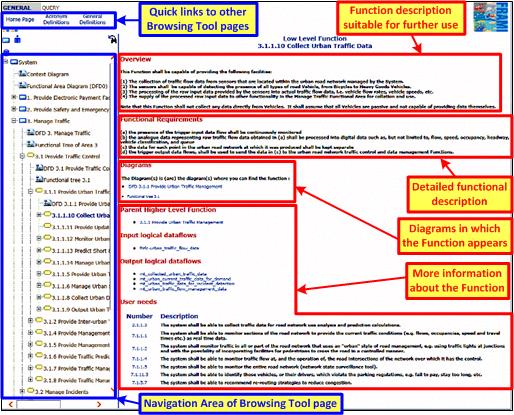
Step 8. The Browsing Tool will need to be set-up by following the instructions on the web page, which also explains how to run the Tool. When run, the Tool will initially display its home page, from which the contents of the FRAME Architecture can be viewed. A sample of its display for part of the functionality is shown below (Click + to show) Browsing Tool pages for the data flows and data stores will be similar in appearance, and it is also possible to display data flow diagrams (DFD's).
Step 9. Navigating through the Architecture can be done using the Navigation Area on the left or through the links provided by the "blue" coloured text in the main part of a page. Guidance about how to navigate through the FRAME Architecture using the Browsing Tool is also provided on the home page and in the FRAME web page referred to in Step 7.
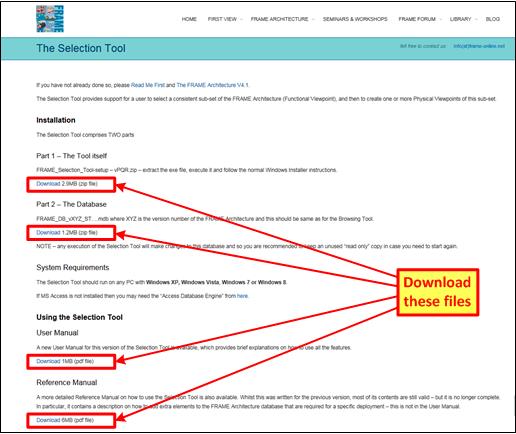
Step 10. Once you are happy with the way that all the service descriptions have been matched to the User Needs, download the FRAME Selection Tool. To do this, click on the "FRAME Architecture" tab at the top of the page and on "The Selection Tool" in the drop down list that appears. The web page that appears is shown in the diagram below and it provides instructions for downloading the Tool, the database it uses, its User Manual (needed for Steps 1-13) and the Reference Manual (needed for Step 6). (Click + to show)
Step 11. Once the Selection Tool has been set up, the User Manual will provide guidance about its use to create ITS architectures. This involves selecting the FRAME User Need Descriptions identified in Steps 4 and 5 and using the Tool to include the functionality needed to support them (functional viewpoint), the physical viewpoint and - if needed - the organisational viewpoint.
The Selection Tool will perform checks on the logical consistency of the functionality that is included from the User Needs you have identified in Steps 4 and 5. It will expect you to resolve any inconsistencies by adding/deleting functions, data flows, data stores and terminators. If you haven't already downloaded the Browsing Tool in Steps 7 and 8, follow the instructions above. It is essential to use this Tool to study the FRAME Architecture to see what is causing the logical inconsistencies.
Step 12. The Selection Tool allows several physical and organisational viewpoints to be created for one functional viewpoint, which is part of the process of finding the optimum configuration (See Next Steps).
Step 13. To create a sub-set ITS architecture, a new physical viewpoint is created that includes as much of the functional viewpoint as is required by the sub-set. Several sub-set ITS architectures can be created from one functional viewpoint using the FRAME Selection Tool. It is possible to experiment by selecting different parts of the functional viewpoint - or to create different physical viewpoints for the same selection.
The FRAME Selection Tool produces a set of files that contain tables providing details of the contents of the functional, physical and organisational viewpoints. It is also possible to export the contents of the viewpoints as a separate database for use with tools such as ACCESS.
Due to the flexible nature of the FRAME Architecture, because it is intended to be easily adapted to suit individual ITS implementations, it has not been possible to create an automatic diagram creation feature. But these can be easily created using the tables and a drawing tool such as VISIO.
The following figures illustrate some of the materials that can be produced as a result of creating an ITS architecture from the FRAME Architecture, using the output from the FRAME Selection Tool. They relate to the ITS architecture developed for Kent County Council in the UK and are reproduced by kind permission of that Council.
The diagrams and tables shown below have been created from the tables produced by the FRAME Selection Tool. Using these tables, other diagrams and tables can be created that are important to specifying and visualising the architecture.
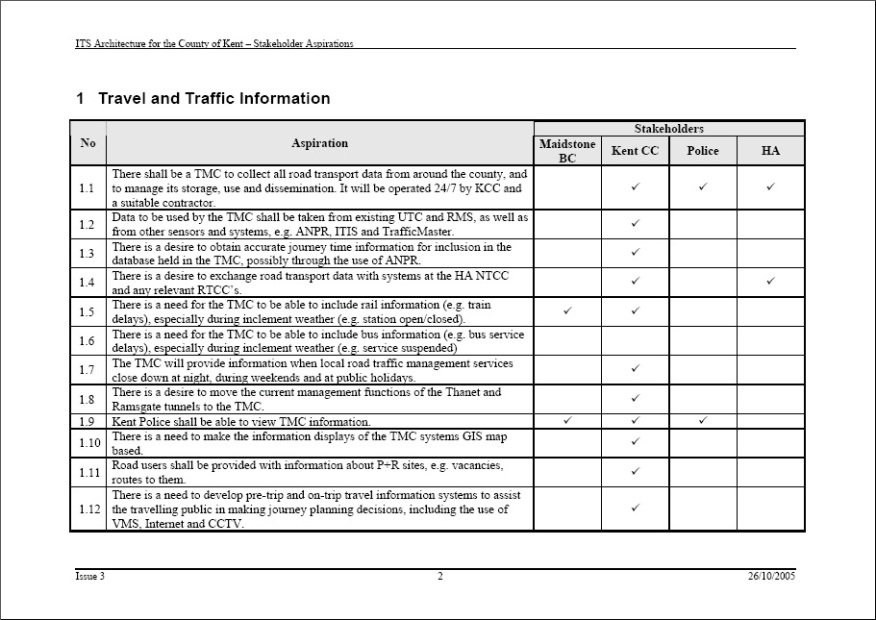
This diagram shows a sample page from the list of service descriptions that were produced from the "stakeholder aspirations" resulting from the stakeholder consultation exercises carried out by Kent County Council (KCC) before the ITS architecture was created.
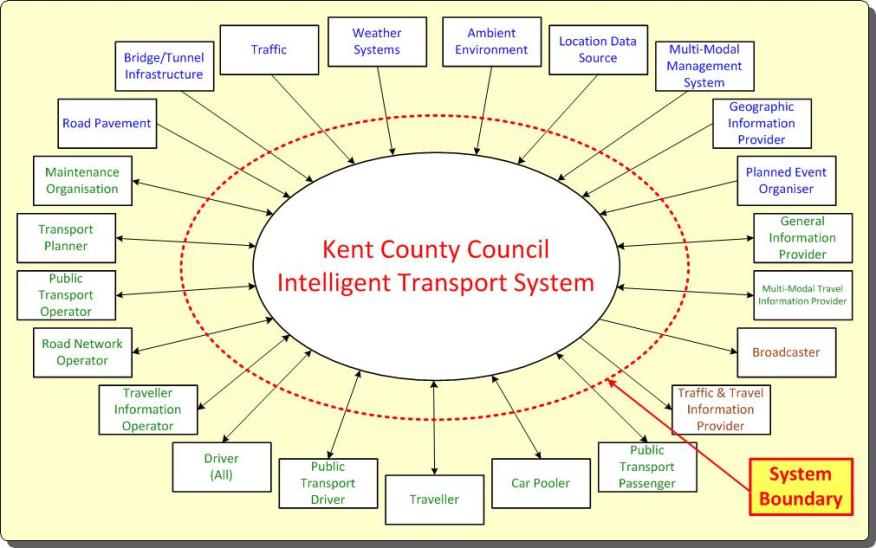
The "context diagram" shows the communications links to all the entities outside the Kent ITS Architecture. The system boundary is shown by the red dashed line. Some of the communications links that cross the system boundary will be electronic, such as link to the Maintenance Organisation, whilst others will be through human machine interfaces (HMI), such as links to "Operators" and Travellers. In the example shown, the term "operator" means a person responsible for managing a computer system. Other communications links will be different again. For example, links to “Traffic” will be through a variety of mechanisms.
In the example from the Kent ITS Architecture below, all the components have been grouped into three "sub-systems". Other ITS architectures could have more or less of these sub-systems.
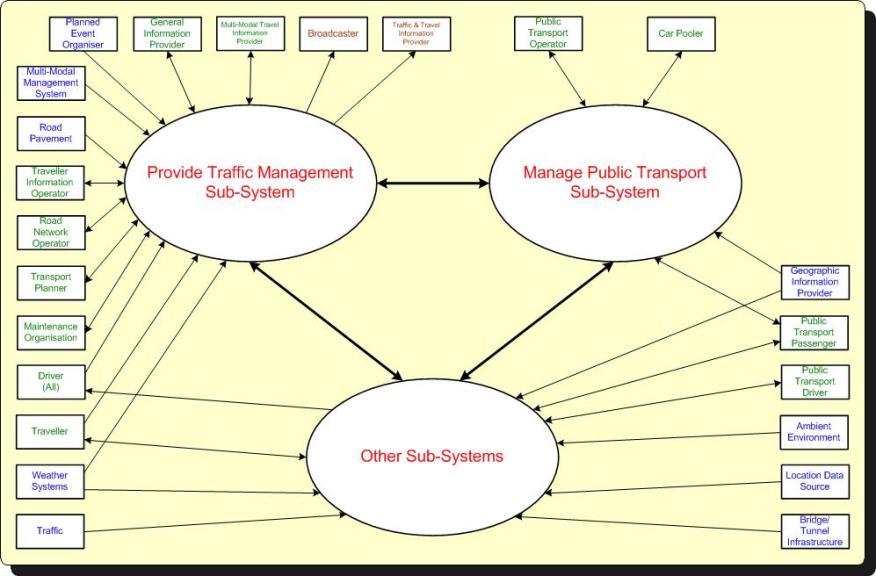
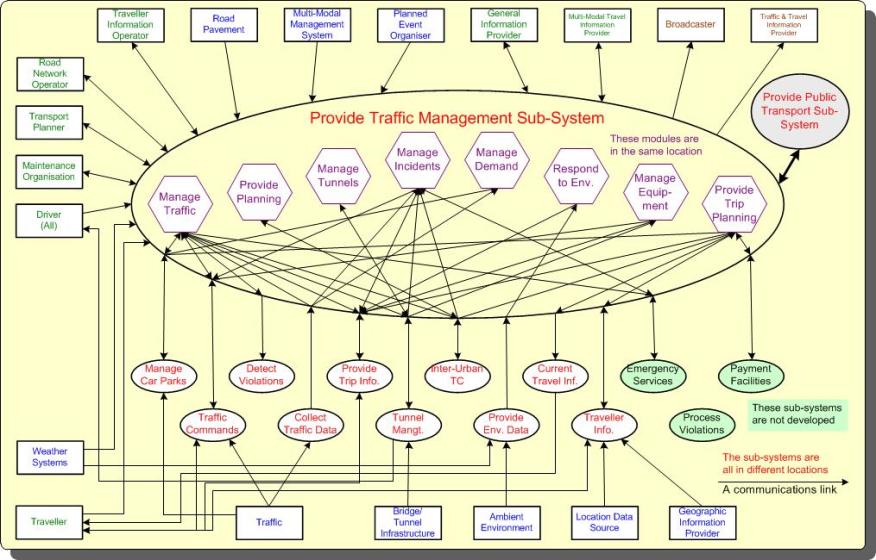
The components within this sub-system have been grouped together to form several "modules", each of which delivers all or part of a service. For each "module" its communications links to the world outside the Kent ITS Architecture are shown and are the same as the links shown in the context diagram. Similar diagrams to this were produced to show the modules in the other two sub-systems.
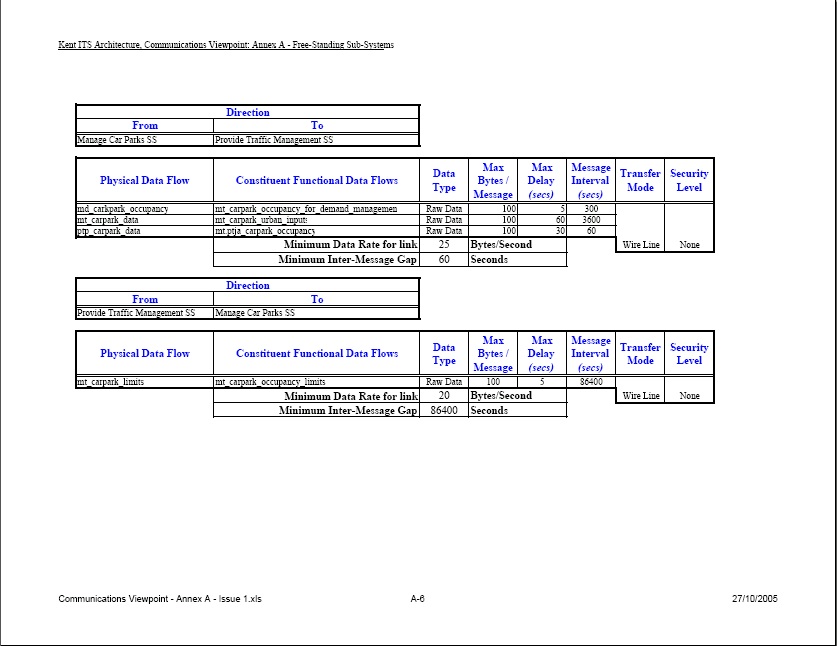
This is part of the table in the communications viewpoint which shows the requirements for some of the communications links identified in the physical viewpoint. In this particular instance, the link is between two modules in different sub-systems. Other similar tables were produced for other electronic links between modules, sub-systems and for the exchange of data with the outside world. The information in these tables would be used to define the types of links required and help specify the standards with which they must conform.
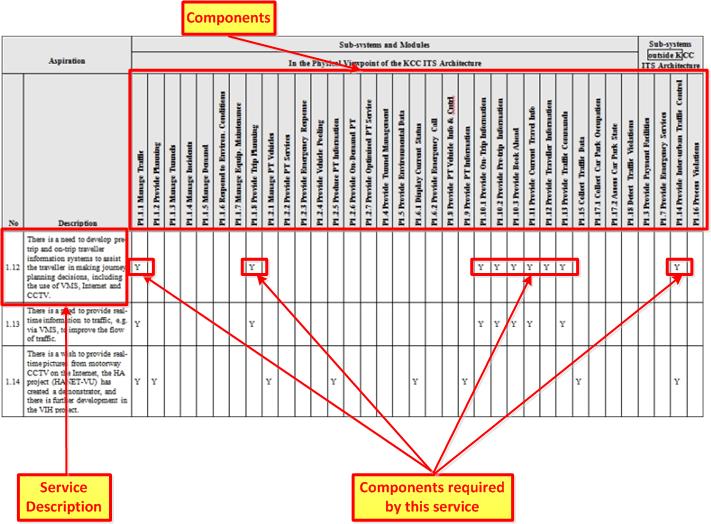
This is part of the table that shows the links between the "aspirations" created by the stakeholders and the "modules" in the physical viewpoint. This table is most useful if the services are to be implemented over a period of time, as it shows which "modules" will be needed by each service. In some instances additional services can be provided "for free" because the components specified in the physical viewpoint have the capability to be shared.
Additional diagrams and tables can be created for other viewpoints that will provide more detailed insights into an ITS architecture (See What is ITS Architecture?). Examples could include:
Free information about using the FRAME Architecture - including extending it - is available from the FRAME Architecture website at: http://www.frame-online.net/. To find some of this information, scroll down the home page to find links for specific topics. The web site’s “FAQ” facility (in the "FRAME ARCHITECTURE" drop down menu) and its pages in the "LIBRARY" drop down menu, for example "Articles and Papers", provide further information. Any questions (and comments) that are not answered by any of these resources can be sent to info@frame-online.net.